A picture is worth a thousand words, the saying goes. But what if the words make use of data storytelling? For a trucking fleet, any “story” must have a point: increased efficiency, lower costs, safety improvements, for example. Let’s examine what data can tell us about two main areas that are important for fleet management—fuel consumption and safety.
Data storytelling and the ISAAC Coach
The ISAAC Coach provides in-cab coaching to drivers in real time to guide driving behavior that has been proven to maximize fuel efficiency. Of course, some factors that affect fuel consumption are out of drivers’ hands. The ISAAC Coach accounts for things drivers don’t control, such as aerodynamics, slope, truck load, and wind. Other factors, such as accelerator use and braking, are controlled by the driver.
By increasing driver engagement safely without adding any distraction, the ISAAC Coach generates up to a 5% savings in fuel use across a fleet. That percentage, multiplied by many trucks, typically translates to a substantial amount of savings that directly touch operating expenses.
Try our fuel savings calculator
The ISAAC InMetrics gateway, the ‘black box’ mounted on each truck equipped with ISAAC technology, is designed to collect high-quality data and transmit it continuously through a wireless access point. It collects a very large amount of data and transmits this telemetric data to the ISAAC ecosystem servers.
The telemetric data that flows through ISAAC’s technology takes the form of both structured and unstructured data. Simply put, structured data is organized and readily searchable, such as product SKUs or dates, for example. Unstructured data has no predefined model or organizational structure. Photos, emails, and social media posts are examples of unstructured data. This type of data is more complicated to process and analyze, but it accounts for the majority of data. Whether structured or unstructured, once the data is collected and organized, using visuals is a powerful tool to better understand what the data reflects.
Data preparation
With 10,000 records per second being collected into its platform, it’s clear that there is an overwhelmingly large amount of data. That’s where data preparation—cleaning and organizing the data—comes in.
At ISAAC, we apply different types of data transformation techniques based on the currently recognized best practices. We conduct data quality checks and fix any data issues identified during these checks.
Most importantly, we ensure data security, data access management, and proper data governance. At ISAAC, proper data governance means that the data is owned and governed by each client rather than by ISAAC itself or some third party. This point is far more significant than many realize, as ISAAC’s founder explains here.
Data visualization
As the name implies, data visualization simply means the visual representation of data. For example, a table of numbers is replaced with something more visually effective in nature such as a chart or map. When done effectively, it should reduce the amount of time for your audience to consume and understand the data.
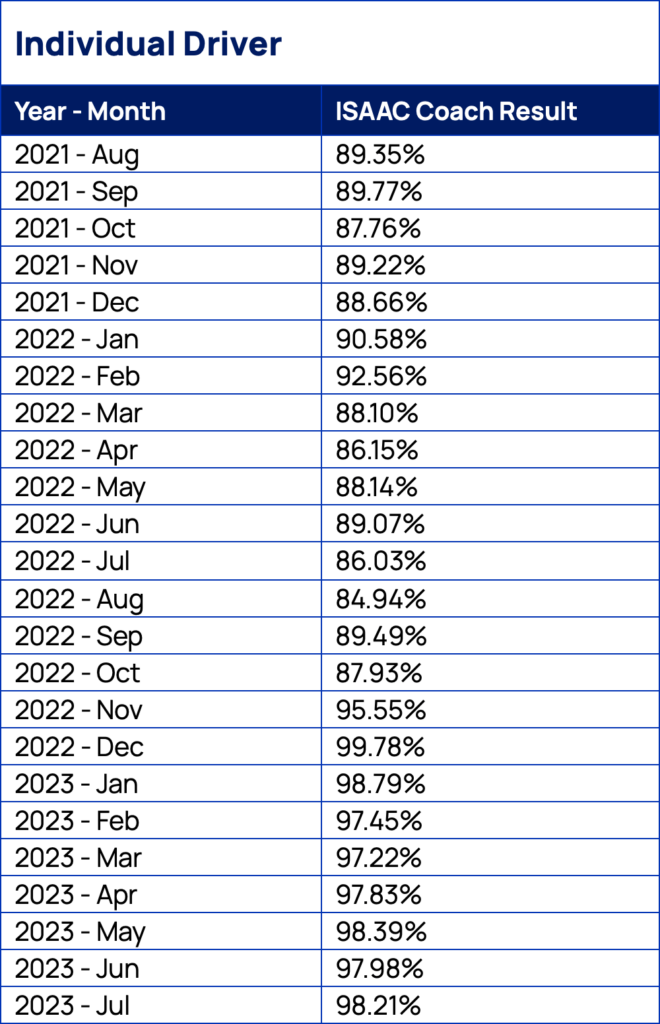
A simple example of this is a data representation from the ISAAC Coach. Figure 1 shows sample data for two years’ worth of ISAAC Coach Results for one driver:
Figure 1.

In Figure 2, we have the same data represented in a line chart with a year-over-year visualization:
Figure 2.

Looking at the line chart, it’s quite evident that the ISAAC Coach Result for this driver was steady in 2021 and most of 2022. But towards the end of 2022 and in 2023 there was a noticeable improvement. Although the table has the same underlying data, the chart makes it easy to visualize the trend as well as the magnitude of the change, resulting in the narrative jumping off the screen.
Analyzing data to see what we can learn
Data analysis refers to the exploration of the data to gain useful insights—in other words, to see what story the data is telling. We often use data visualizations to make more meaningful discoveries more quickly.
As an example, Figure 3 below is the same visual as above but for an entire fleet rather than a single driver.
Figure 3.

It’s very clear the ISAAC Coach Result for the entire fleet improved significantly towards the end of 2022. Some questions we can ask include:
- Are there particular groups in this fleet that accounted for most of these gains?
- Are there other groups that didn’t follow the fleet-wide trend?
If we filter the data based terminals within this fleet (see Figure 6 below), we can explore the data further. Looking at Terminal #6, we can see this group definitely contributed to the company-wide improvements:
Figure 4.

However, if we visualize the data from Terminal #9, as shown in Figure 5, then it tells a different story:
Figure 5.

Clearly, Terminal #9 made no significant headway when it comes to improving the ISAAC Coach Result even though the fleet as a whole showed large improvements.
Data storytelling is explaining the results of data analysis in a way that is understandable and impactful with the goal of influencing business decisions. So, once we have discovered the fleet-wide improvement and the variation between terminals, can we summarize our findings in a clear and concise visualization.
Here in figure 6 is a graph that shows each terminal’s performance improvements, ranked in order:
Figure 6.

In this visual, we can see where Terminal #6 and Terminal #9 are relative to each other as well as to the rest of the terminals when it comes to ISAAC Coach Result improvements over the past year. We can also see that three terminals improved more than Terminal #6 and one terminal that regressed more than Terminal #9.
So, if improving the ISAAC Coach Result is an important goal for this particular fleet, then this chart tells a significant part of the story. The main pieces of information it illustrates are:
- The level of attainable improvement
- Which terminals it makes sense to prioritize going forward to make the most impact without spreading training resources too thinly
Making a business case using data storytelling
Imagine for a moment that you need to convince management that your fleet’s ISAAC Coach Result is a metric worth focusing on. How could you tell a compelling story about that? Let’s go back to this company-wide chart (see Figure 7):
Figure 7.

Visually, we can see that the ISAAC Coach Result from 2022 was around 85. In the first part of 2023, it improved to around 89. How can we express this in a way that shows the actual impact of this improvement?
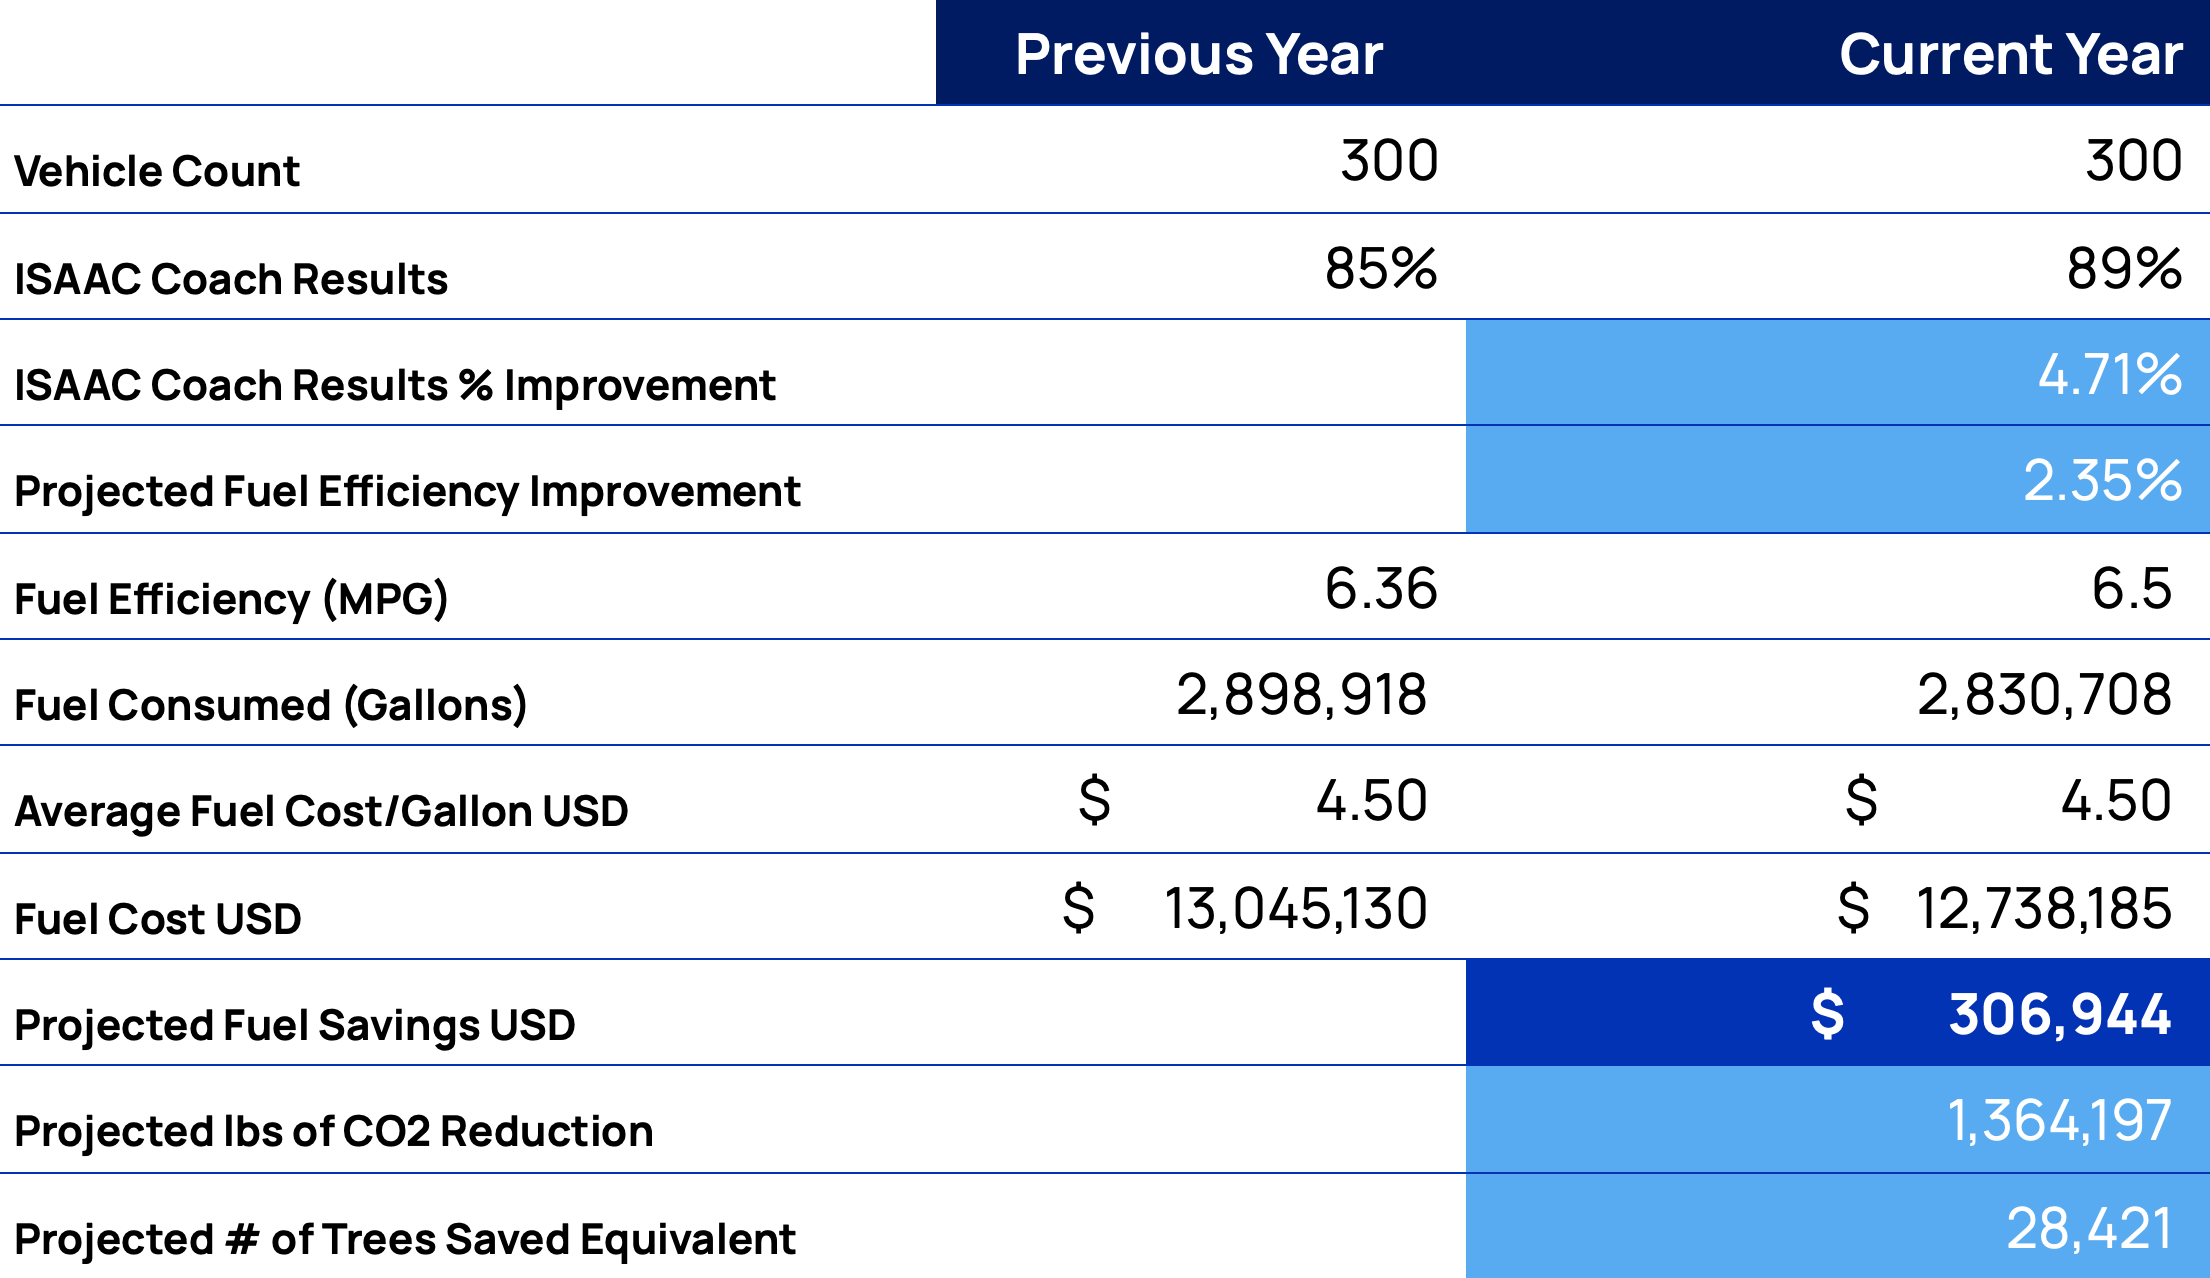
Based on data from real-world testing, we can project that a 4.7% (85 to 89) improvement in the ISAAC Coach Result should result in approximately a 2.35% improvement in fuel efficiency.
For a fleet of 300 trucks, Figure 8A shows the impact in terms of fuel savings and the projected impact on the environment:
Figure 8A.

Assumptions:
- Based on real-world testing, for every 10% improvement in ISAAC Coach Result, fuel efficiency improves by 5%
- Average fuel cost in the US in 2022 approximately $4.99 per gallon
- For every gallon of diesel consumed, 20 lbs of CO2 is released into the atmosphere
- The average tree removes 48 lbs of CO2 per year from the atmosphere
Why good stories live on
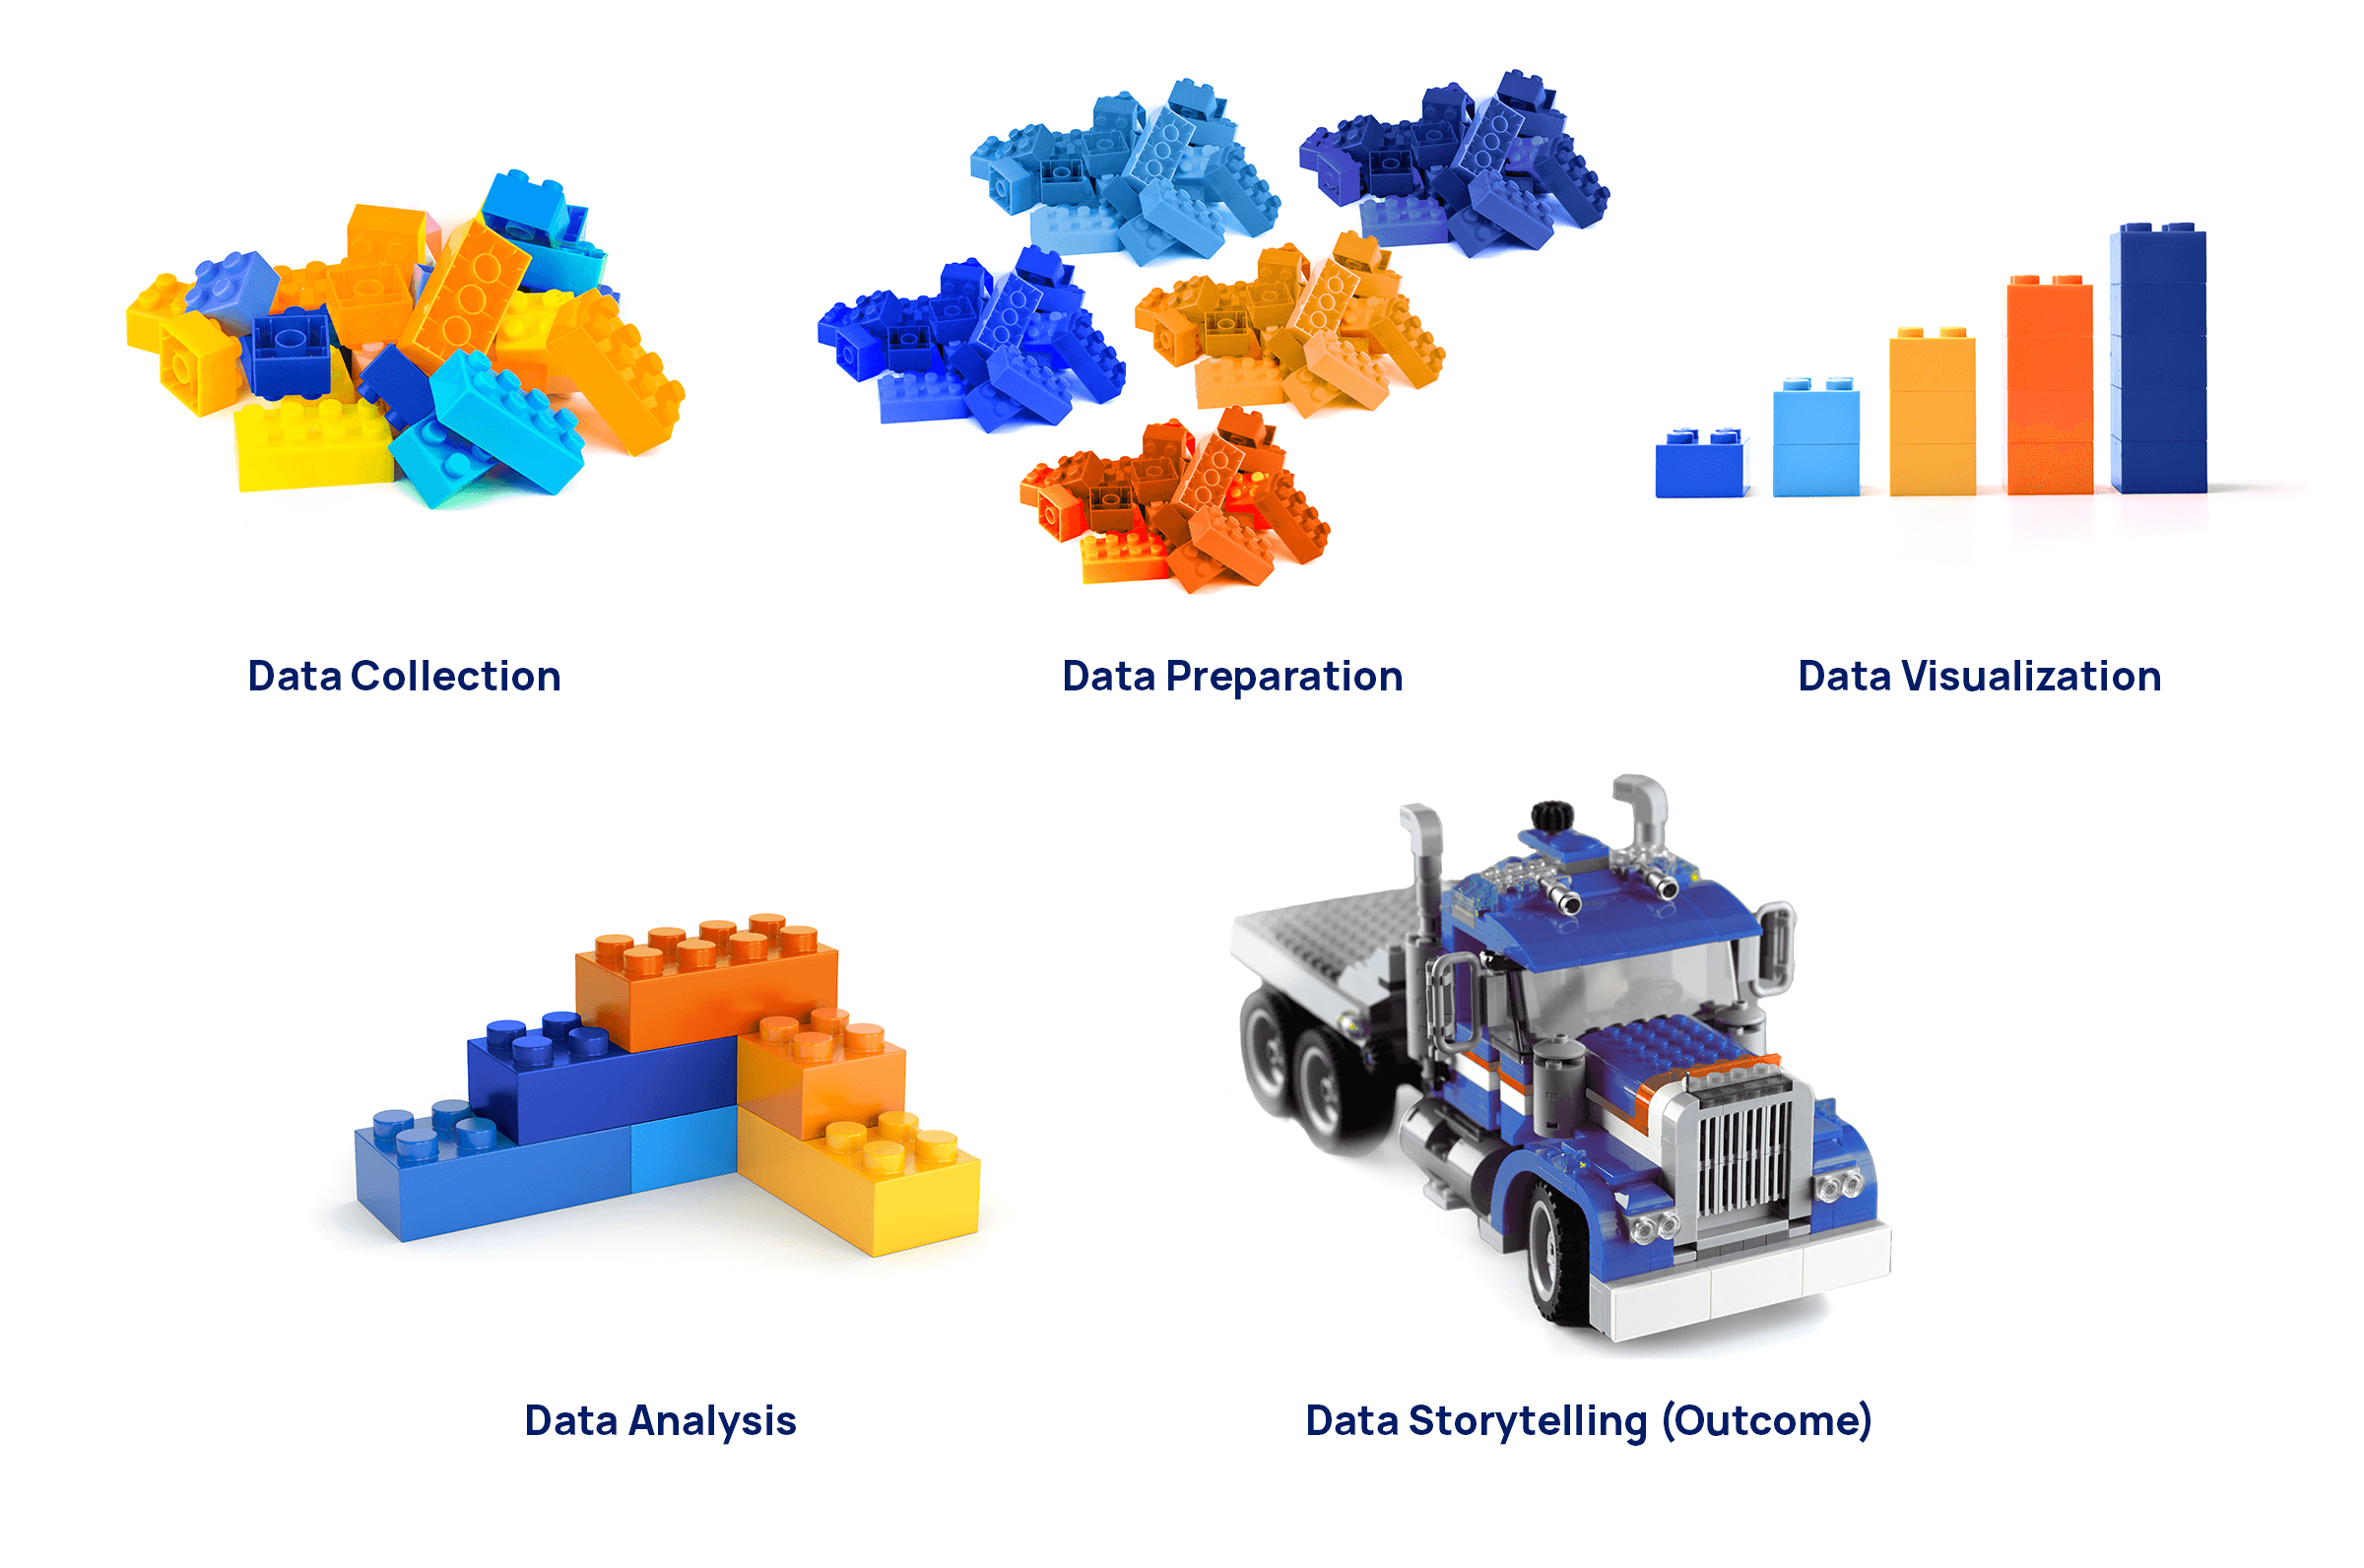
Looking over the story about the fleet in the example above, it’s clear that even a single-digit percentage improvement such as 5% can add up to some very significant cost savings. In fact, the “moral of the story” would be that it pays to collect, prepare, visualize, analyze, and tell useful stories with your data.
Figure 9 is a simple visualization of the process it takes to get to this kind of storytelling:
Figure 9.

Contact us to learn more about how the ISAAC Coach can help your drivers and your overall fleet—including exploring the kind of savings your fleet could realistically achieve.
About the authors

Rahat Yasir, M.Sc.
Director of Data Science – AI ML, ISAAC Instruments
Rahat Yasir is Director of Data Science – AI ML at ISAAC. He leads initiatives for building a data-driven and AI-powered transportation industry. He was selected as Canada’s top software developer under 30 in 2018. He is an eight-time Microsoft Most Valuable Professional Award holder in the Artificial Intelligence category. He has years of experience in imaging and data analysis application development, cross-platform technologies and enterprise systems designing. He is the author of multiple software engineering books and research publications in the data science domain.

Kyle Niiya
Business Intelligence Analyst – ISAAC Instruments
Kyle Niiya is a Business Intelligence Analyst at ISAAC and has over 18 years of IT systems and business experience in the transportation industry. His role within ISAAC’s Data and AI team is to ensure that the information being provided to our clients is relevant and is displayed in a clear and effective manner. His love of data analytics will help our clients in making informed decisions to improve and grow their fleets.


